# Web UI
# Introduction
Enlightn provides a beautiful web UI dashboard where you can view your Enlightn reports triggered from your CI or scheduled command runs.
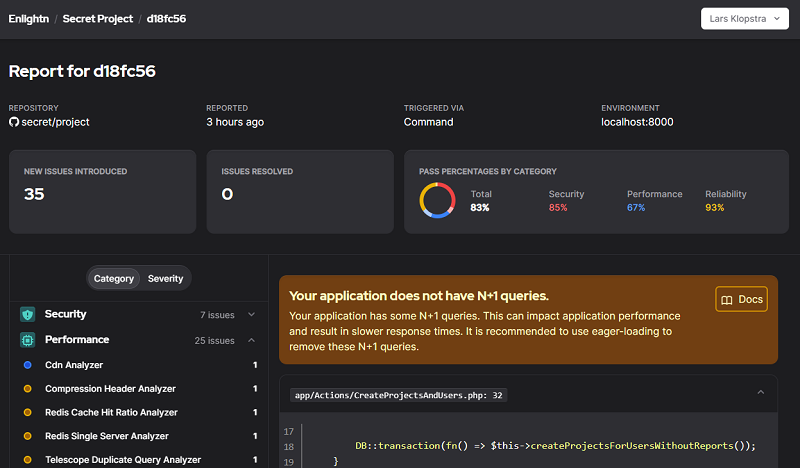
The web UI dashboard includes the following:
- Statistics on pass percentages (overall and by category).
- All failed checks along with code snippets related to the checks (if any).
- Metrics on number of new and resolved issues (compared with the most recent report running on the same app URL, environment and project).
# How To Get Access (Free)
To get access to the Enlightn Web UI, all you need to do is signup for free on the Enlightn website (opens new window)!
You can then navigate to the relevant project (or create a new project) on the projects page (opens new window) and obtain an API token. Then, configure the credentials (the project API token and your registered email) in your .env file:
/*
|--------------------------------------------------------------------------
| Credentials
|--------------------------------------------------------------------------
|
| The following credentials are used to share your Enlightn report with
| the website. This allows you to share your report with colleagues
| and view changes in reports over time.
|
*/
'credentials' => [
    'username' => env('ENLIGHTN_USERNAME'), // your registered email
    'api_token' => env('ENLIGHTN_API_TOKEN'), // your project API token
],
# Triggering Reports
To trigger an Enlightn report to be created, just add the --report flag on the Enlightn command. Make sure you've added the project API token and username (registered email) to your config/enlightn.php file.
So, to trigger a report from your CI environment, just add the --report flag:
php artisan enlightn --ci --report
To trigger a report manually from the terminal or as a scheduled command, you may run:
php artisan enlightn --report
If you have the Enlightn Github bot configured properly, reports will automatically be created every time the Github action is run.
# Inviting Team Members
Enlightn Pro business and enterprise license owners may also invite team members to access the web UI for all reports on the same project. Remember that the project must be linked to a business or enterprise license in order to be able to invite other team members.
To invite team members, login on the Enlightn website and then visit the projects page (opens new window). Navigate to the project and then click on team members. You can invite team members here.
# Information Shared
For the web UI to function properly, it needs some information on which checks failed, the associated lines of code, etc.
To be completely transparent as to what information is sent, we are including the details here:
- Project Metadata: app name, app env, app URL, Composer project name, etc.
- Analyzer information (for each check): title, status (passed/failed), analyzer metadata (such as the docs URL, severity, etc.), line numbers of the code associated with the failed checks, code snippet of 30 lines surrounding the code responsible for failed checks.
- Analyzer stats: includes how many analyzers passed/failed/skipped, etc. by category.
This information is sent to the Enlightn website whenever you have the --report flag set when running the Enlightn command.
If you do not wish to share this information, you may exclude the --report flag. In this case, you will not be able to view your reports in the Web UI or use the Enlightn Github bot, as both require the same information. You are free to use any other features of Enlightn as they do not entail sharing any information.